Competitive benchmarking goes wrong in a specific and repeatable way. Someone builds a table, puts your numbers next to four competitors, and every cell was measured differently. The deck looks rigorous and means nothing.
Getting it right is mostly discipline, not tooling.
Key takeaways
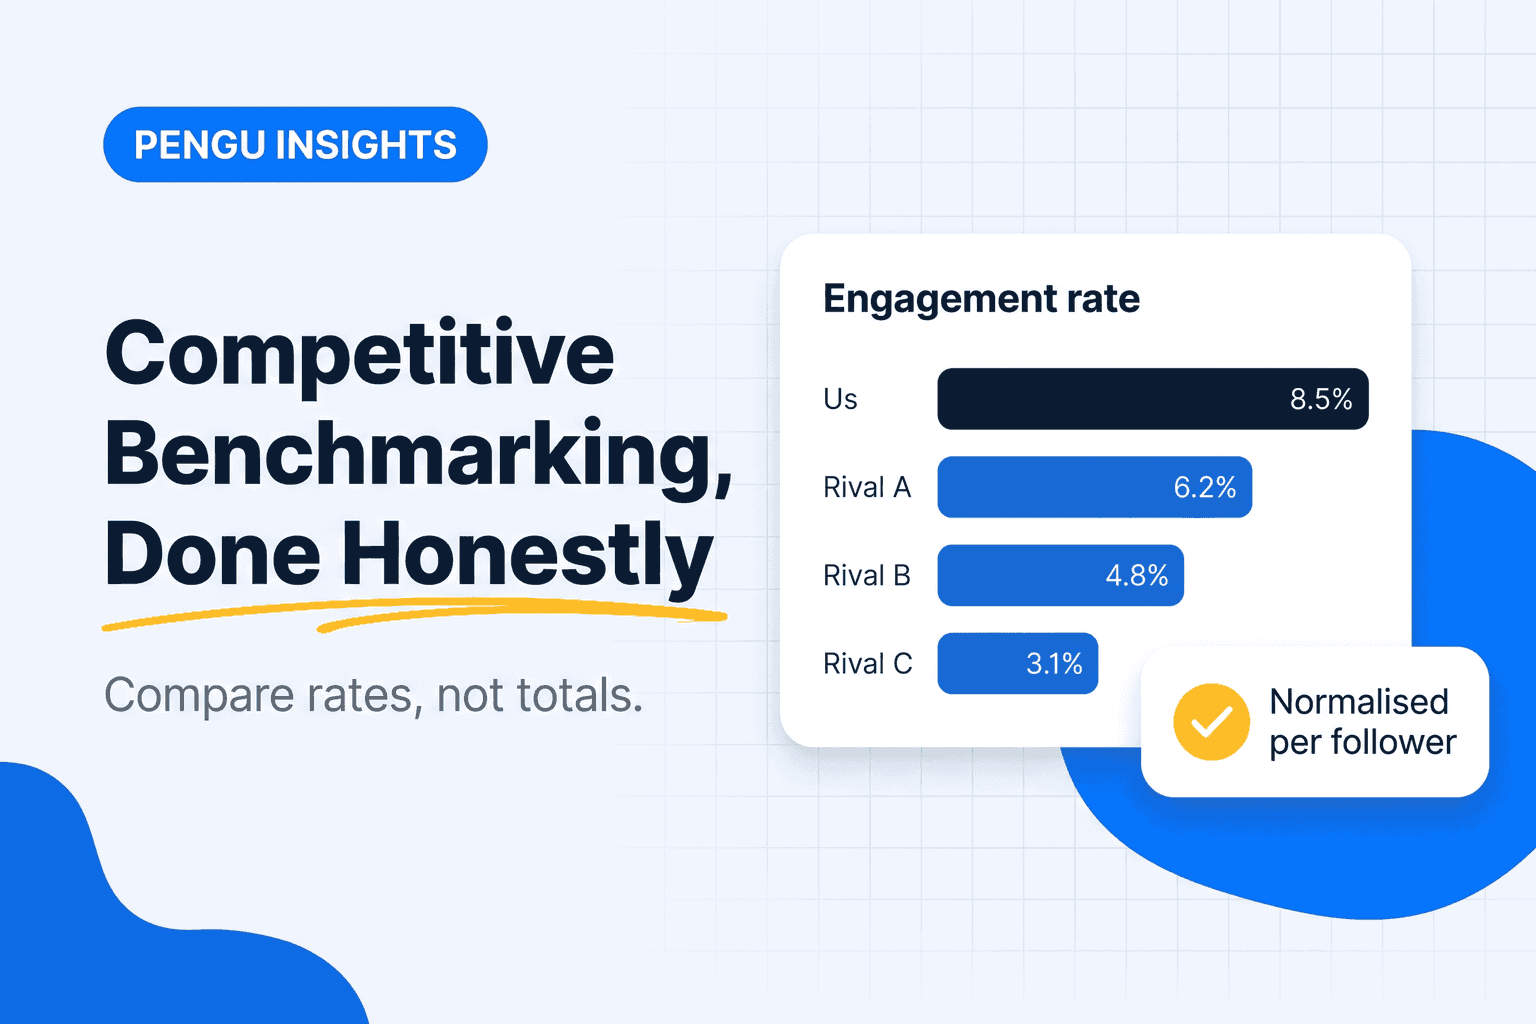
- Compare rates, not totals. Totals measure company size.
- Fix the competitor set before you see any numbers.
- Never mix measured data about you with estimated data about them in the same column without labelling it.
- Quarterly is the right cadence for most teams.
Video: what benchmarking measures, in three minutes
A short interview with a market researcher that makes one point well: most companies have never quantified what they believe about their competitors.
Three things worth taking from it:
- Benchmarking is quantitative by nature. It measures your brand, product or service against named competitors on the same scale. Exploring who the competitors are is a different, qualitative job.
- Assumptions differ inside the company. The executive team, sales and service usually hold different pictures of the competition. Collecting those before measuring is part of the work.
- Validate or falsify. The value of the first benchmark is that it settles arguments with data, in both directions.
The metrics in the next section are the ones you can collect without a research firm; the interview is a reminder that the internal alignment matters as much as the numbers.
The four mistakes that invalidate competitive benchmarking
1. Different time windows. Your 90-day figure against their 30-day figure is not a comparison. Same window, always, even when the good-looking window is tempting.
2. Mixing measured and estimated. Your traffic comes from Analytics and is real. Theirs comes from a model and is not. Put both in one column without a note and you have built a lie you will eventually repeat in a meeting.
3. Ignoring size. A brand with ten times your audience will beat you on every absolute number, which tells you nothing you did not already know.
4. Choosing the set afterwards. If the competitor list changes once the numbers arrive, you are not benchmarking, you are decorating a conclusion.
Metrics that are actually comparable
| Instead of | Use | Why |
|---|---|---|
| Follower count | Engagement rate | Normalises for audience size |
| Total keywords | Share of keywords in top 10 | Position 60 is not traffic |
| Number of ads | Days the longest ad has run | Survival beats volume |
| Posts per month | Posts per month and median engagement | Volume without performance is noise |
| Estimated traffic | Traffic trend over 6 months | The direction survives model error |
| Backlink count | Referring domains from the last 12 months | Old links flatter old companies |
The normalisation step nobody does
Once you have raw numbers, divide by something that captures scale. Any of these work:
- Per follower for social metrics
- Per published page for content metrics
- Per employee if you can see headcount on LinkedIn
- Per month active for anything cumulative
For your own side of the comparison, Search Console and GA4 are the only measured numbers in the table; everything about a competitor is modelled.
A competitor with 4.9M followers and a 3.35% engagement rate is a different company from one with 40K followers and the same rate, but the rate at least lets you compare their content, which is the part you can learn from.
A benchmark that ends in a decision
Five steps, one afternoon per quarter:
- Lock the set. Three to five rivals, written down before you collect anything. Build it properly using examples of competitors.
- Lock the window. Last complete quarter, same dates for everyone.
- Collect the comparable metrics. The right column of the table above.
- Normalise and rank. Where are you first, where are you last?
- Pick one gap and one lead. Close the gap, defend the lead. Two actions, two owners, one quarter.
A benchmark that produces more than two actions produces zero.
What to do with the result
Where you are behind: ask whether it is a resource gap or a method gap. Being outspent is a resource gap and needs a budget conversation. Being outranked on the same budget is a method gap and needs a different plan.
Where you are ahead: find out why before you assume it will hold. Leads that nobody can explain tend to disappear without warning.
Where you are similar: ignore it. Parity metrics consume attention and change nothing.
Doing it without three days of manual collection
Most of the comparable metrics are public: engagement rates, posting cadence, ranking positions, ad run dates. Collecting them by hand across five competitors is roughly a day per quarter, which is fine if you have the day.
Pengu Insights does the collection from $39 a month, including social benchmarking against a set you define, competitor keywords, and ad longevity from the Facebook ad library. Agency plans export the comparison white label, which matters when the benchmark itself is the deliverable you bill for.
Frequently asked questions
What is competitive benchmarking?
Measuring your performance against a defined set of rivals on the same metrics, over the same period, normalised so the comparison is fair.
What metrics should I benchmark?
Metrics visible for everyone and comparable across sizes: engagement rate, share of top-10 keywords, ad longevity, publishing cadence. Not absolute follower or traffic counts.
How is benchmarking different from competitor tracking?
Tracking watches for changes over time. Benchmarking compares fixed metrics across companies at a point in time.
How often should you benchmark competitors?
Quarterly for most teams, monthly if you publish daily or run continuous paid campaigns.
What makes a benchmark misleading?
Different time windows, mixing owned and estimated data, ignoring size, and picking the competitor set after seeing the numbers.
Written by

Founder of Pengu Insights. Competitive intelligence practitioner for DTC brands and marketing agencies.