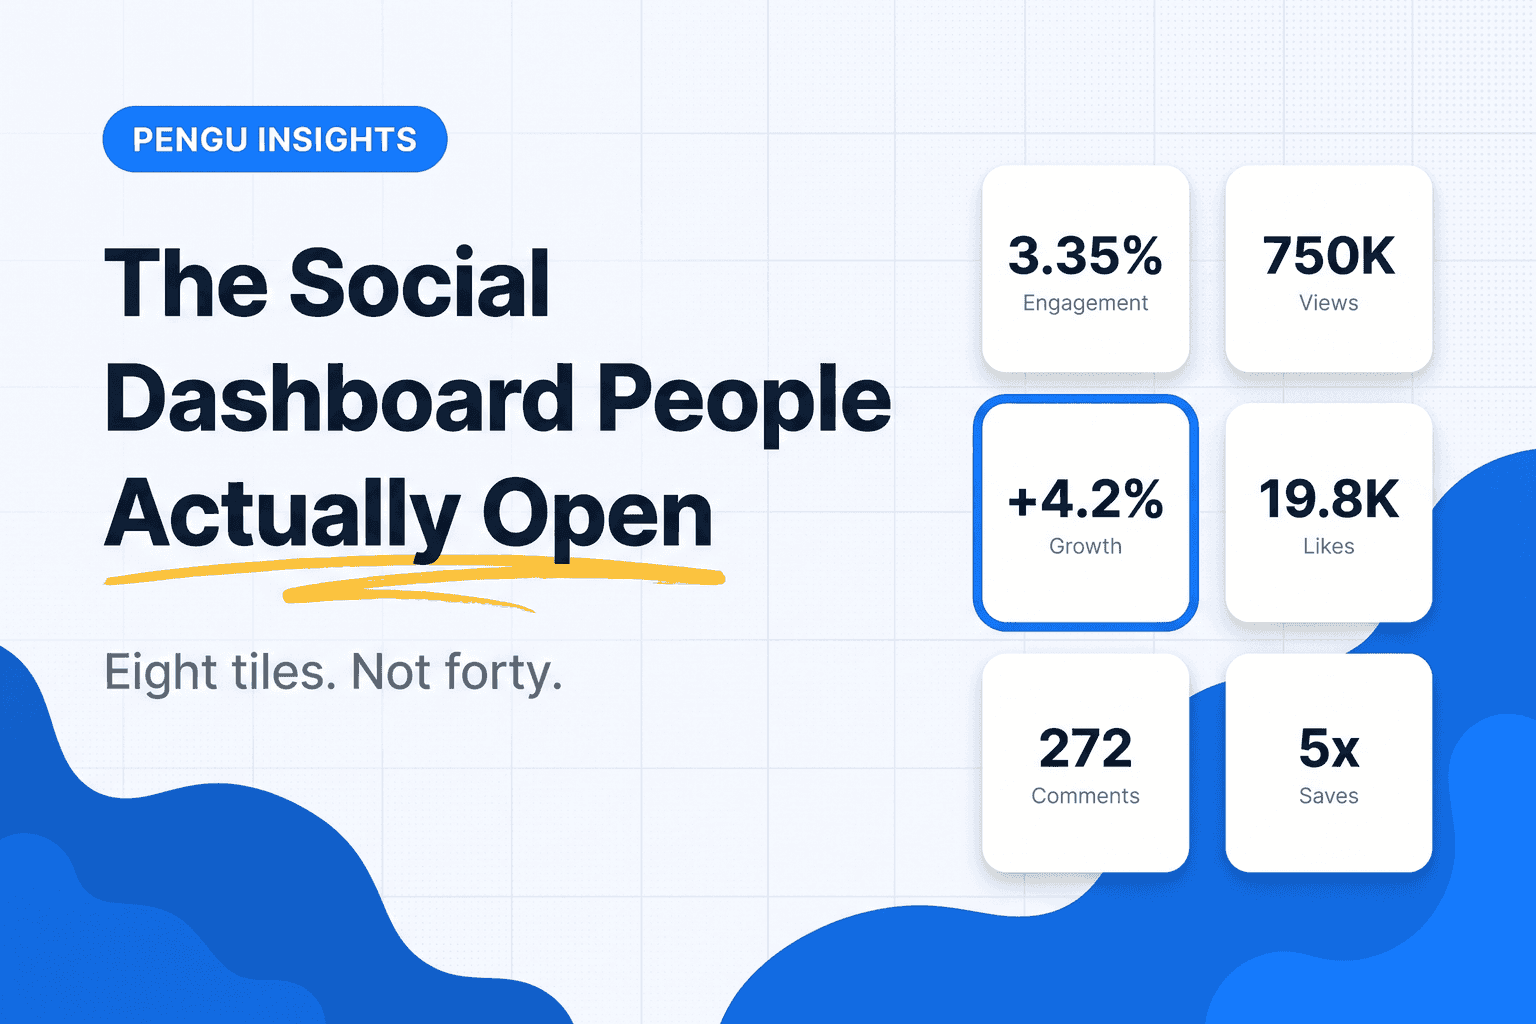
The average social media dashboard displays about forty metrics and answers about zero questions. Everything the API returns gets a tile, the tiles get a colour, and nobody opens it after week three.
A dashboard is not a data display. It is an answer to a small set of recurring questions.
Key takeaways
- Eight tiles is enough. Forty is a decision to not decide.
- Every metric needs a denominator: per follower, per post, per month.
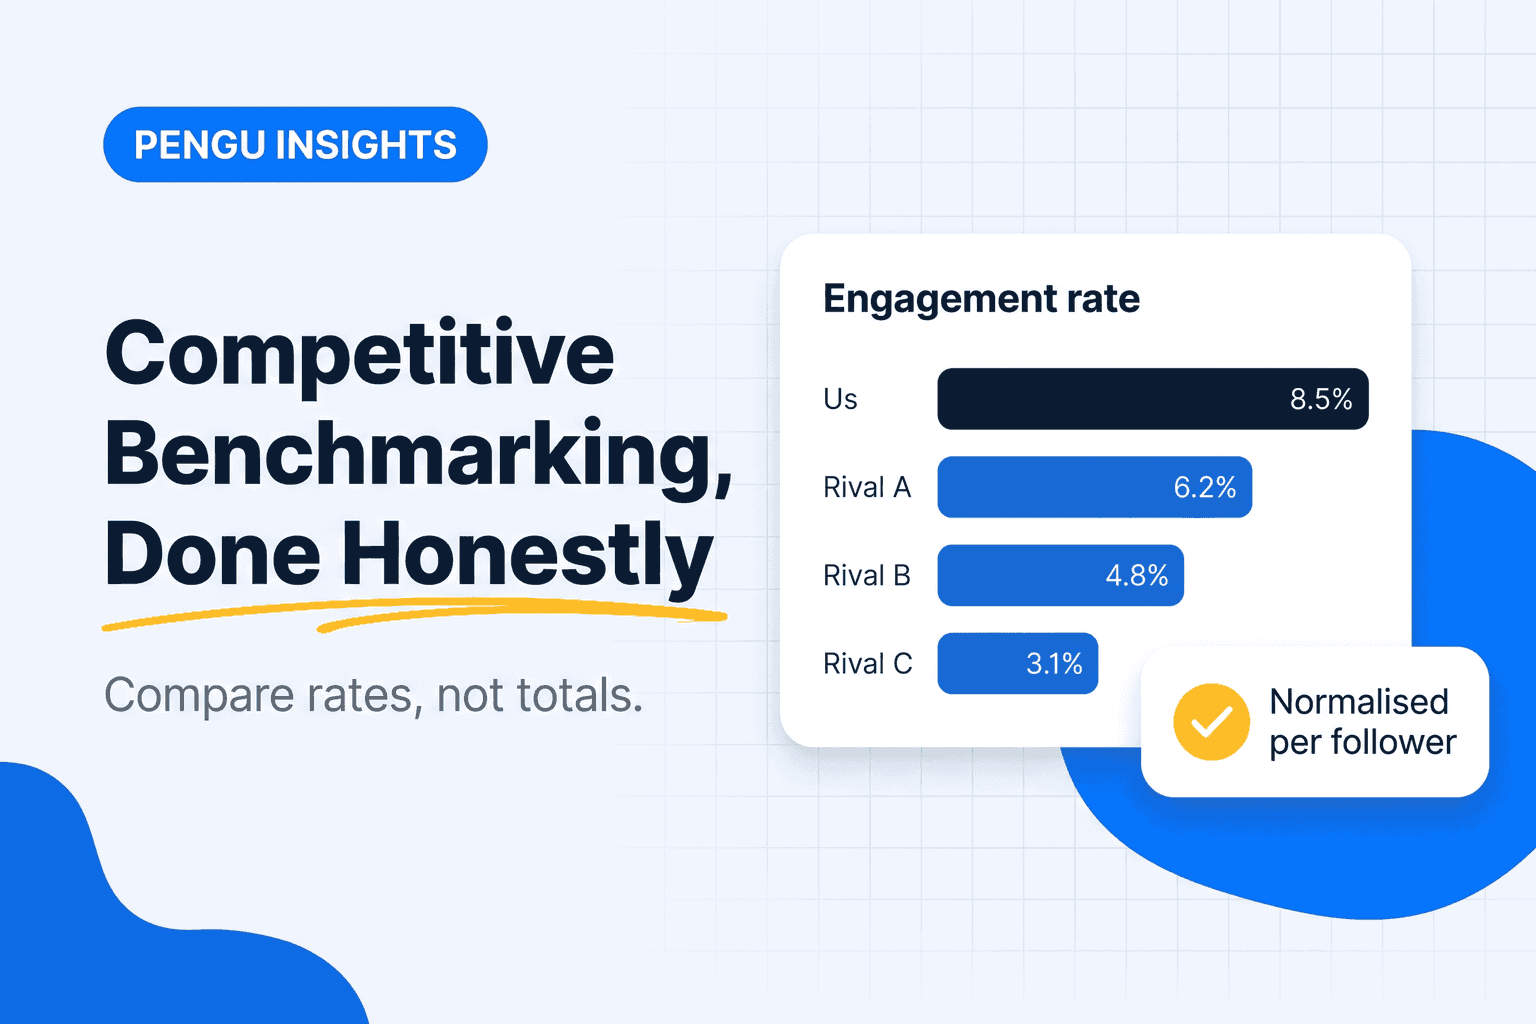
- Without at least one competitor tile, you cannot tell your performance from platform drift.
- Dashboard and report are different artefacts for different people.
Video: building the dashboard in Google Sheets, from a blank file
Twenty-five minutes of building, not describing. If you want the dashboard this week and have no budget, this is the how-to.
Three things worth taking from it:
- Three sheets: data, support, dashboard. Raw rows in one, lookups and totals in the second, charts only in the third. Mixing them is why most spreadsheet dashboards break.
- Define the formulas once. Engagement rate as likes plus shares plus comments over impressions, click-through rate as clicks over impressions, written in the data sheet so every chart agrees.
- Chart by platform and by post type. Followers, engagement and cost split by network, and reach split by image, video and text. That split is what turns a report into a decision.
What the video does not cover is where the rows come from. Exporting from each network by hand is the step that kills these dashboards after a month; the tools below automate that part.
Start from the questions, not the metrics
A working dashboard answers four:
- Is our content getting better or worse?
- Which formats are carrying us?
- Are we growing faster or slower than the people we compete with?
- Does any of it reach the site?
If a tile does not serve one of those, it is decoration.
The eight social media dashboard metrics worth a tile
| Metric | Why it earns the space |
|---|---|
| Engagement rate (engagements ÷ reach) | The only quality metric comparable across account sizes |
| Reach or views | The distribution the algorithm gave you |
| Follower growth rate, as a percentage | Absolute growth flatters big accounts |
| Saves and shares | The two signals most correlated with distribution on Instagram and TikTok |
| Top 3 posts of the period | Where the learning actually is |
| Posting cadence | Explains half the variance in the other numbers |
| Clicks to site, from UTMs | Connects social to the only funnel you own |
| Competitor engagement rate | Turns your number into a position |
Everything else, including impressions without a denominator and cumulative follower counts, belongs in an appendix nobody reads and that is fine.
The three views
The weekly view. Last 7 days versus previous 7. For the person publishing. Cadence, top posts, engagement rate.
The monthly view. Last 30 days versus previous 30, plus competitors. For the person deciding what to publish next month.
Per network, the metrics differ: see Instagram analytics tools, TikTok analytics tools and LinkedIn analytics for what each platform actually reports.
The quarterly view. Trend lines over 90 days and benchmark position. For whoever approves the budget. Our competitive benchmarking guide covers how to make that comparison honest.
Three views, not one dashboard trying to serve all three audiences at once.
Building it free
- Export from native analytics: Instagram Insights, TikTok Analytics, LinkedIn page analytics. Monthly, into a Google Sheet.
- Add UTM parameters to every link so GA4 can attribute clicks.
- Connect Looker Studio to the Sheet and to GA4.
- Build the eight tiles. Ignore the template galleries, which are where forty-metric dashboards come from.
Cost: zero. Time: about two hours to build, twenty minutes a month to feed. The manual export is the part that eventually kills it, which is when people start paying.
Building it paid
Tools split into two groups, and most teams need one from each:
Publishing tools with dashboards: Metricool, Buffer, SocialPilot, Hootsuite and Sprout Social. Strong on your own accounts, weaker on competitors, and priced per seat at the top end. Our Hootsuite alternatives and Sprout Social alternatives posts compare them on price.
Competitive intelligence tools: for the tile most dashboards are missing. Pengu Insights covers Instagram, TikTok and LinkedIn intelligence plus social benchmarking against a competitor set from $39 a month, alongside the SEO data, so the social view sits next to what is happening in search.
What kills a dashboard
- Too many tiles. The failure mode is always addition, never subtraction.
- No denominator. Raw counts grow with the account and teach nothing.
- No external reference. A 20% engagement drop across your whole category is a platform change, not your fault, and only a competitor tile tells you which.
- Manual refresh. Anything requiring a person to update it will be stale within two months.
- Serving two audiences. The publisher and the CFO want different artefacts.
Frequently asked questions
What is a social media dashboard?
A single view pulling performance data from several networks into one place, so you can see how content is doing without opening each app.
What metrics belong on a social media dashboard?
Engagement rate, reach, follower growth rate, saves and shares, top three posts, posting cadence, clicks to site, and competitor share of voice.
Can I build a social media dashboard for free?
Yes: native analytics plus Looker Studio on a Google Sheet, at the cost of manual exports.
What is the difference between a social dashboard and a report?
A dashboard is a live view you check; a report is a snapshot you send. Different audiences, different artefacts.
Should a social media dashboard include competitors?
Yes, at least one tile. Without an external reference you cannot separate your performance from platform drift.
Written by

Founder of Pengu Insights. Competitive intelligence practitioner for DTC brands and marketing agencies.