Think of industry benchmarks as weather reports for auctions. They tell you whether most advertisers faced rain or sunshine last year. They cannot predict whether your umbrella leaks.
Every year, marketers bookmark a Google Ads benchmarks PDF and treat it like a scorecard. That creates bad decisions. Averages hide variance. Your auction is not the average.
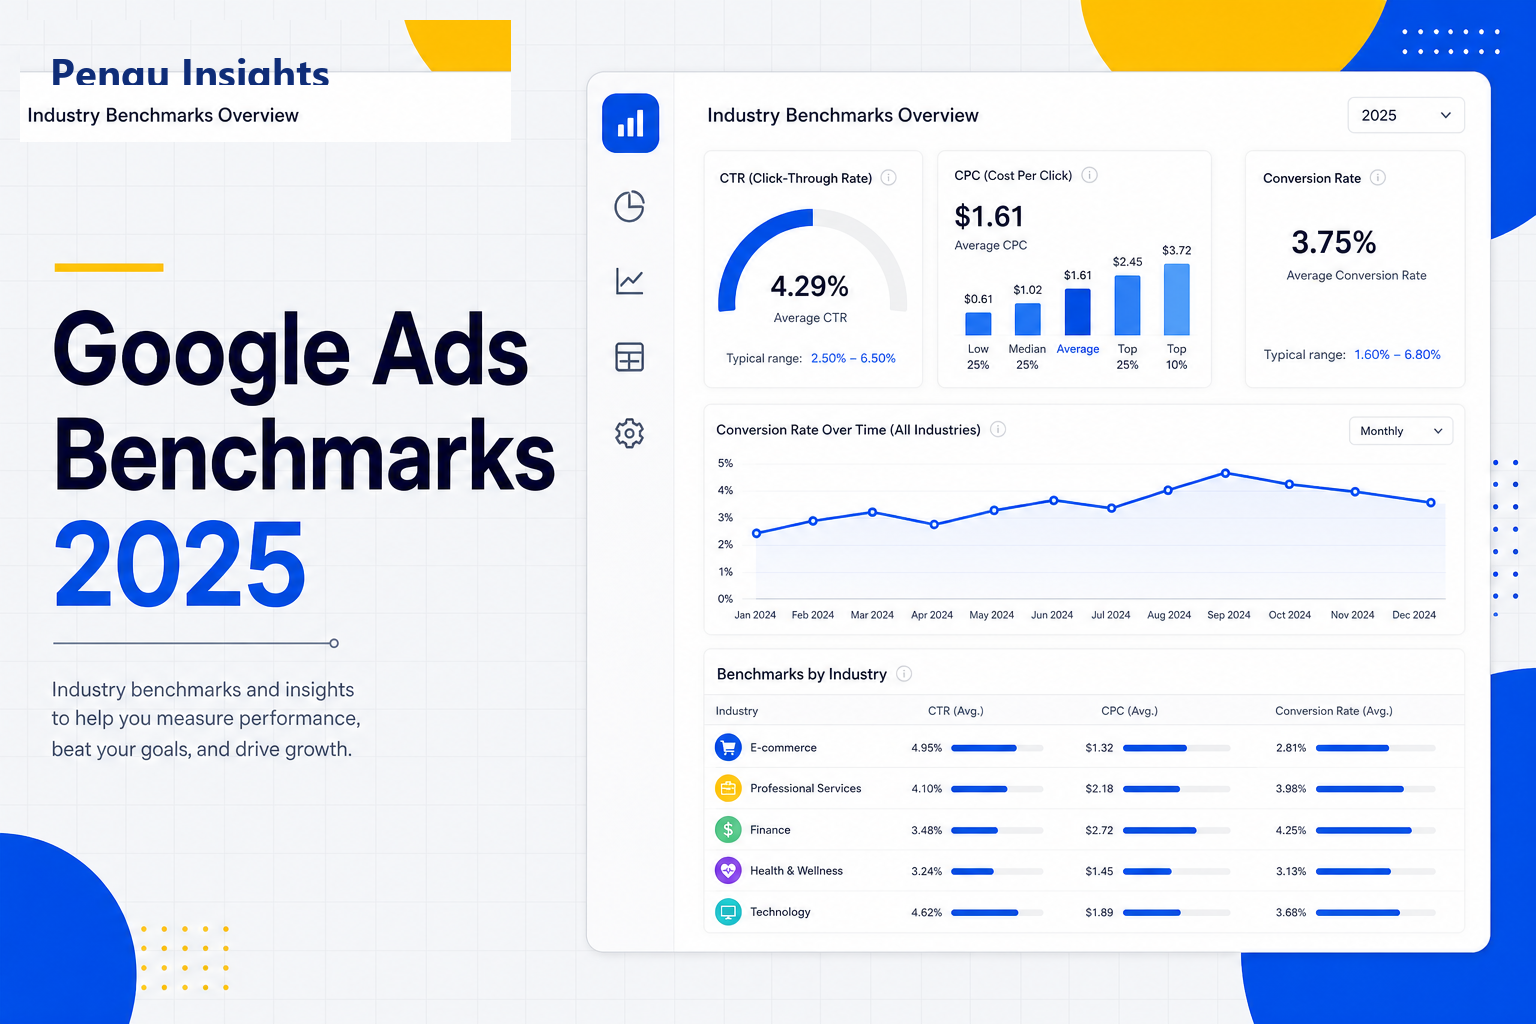
WordStream and LocaliQ published their 2025 Google Ads benchmarks using data from more than 16,000 campaigns running between April 2024 and March 2025 (WordStream, 2025). The headline story is familiar: costs are up, efficiency is uneven, and verticals diverge sharply. This guide explains what those numbers mean and how to use them without pretending your CPA should match a table row.
Key takeaways
- Benchmarks are context, not targets. They describe what happened across thousands of accounts, not what your account should hit.
- CPC rose for about 87% of industries in the WordStream dataset. Plan for auction inflation, not flat year-over-year costs.
- Conversion rate improved for roughly 65% of industries. Better landing pages and bidding helped some teams absorb CPC pressure.
- CPL climbed more mildly, around 5% on average. Lead gen did not explode everywhere, but margin for error shrank.
- CTR was mixed. Some verticals gained attention, others fought noisier SERPs and AI surfaces.
Video: a free, live Google Ads benchmark you can cite
Static benchmark tables age fast. This three-minute walkthrough shows a free public dashboard that updates weekly, split by campaign type.
Three things worth taking from it:
- Benchmarks by campaign type, not just by industry. The dashboard separates Search, Performance Max and Shopping. A blended CPC hides the fact that Shopping and Search behave differently.
- Rates and ratios, not just volumes. CTR, conversion rate, return on ad spend and average order value are shown as time series, so you can see whether a change in your account is you or the market.
- You can quote it. The publisher states the data can be used in reports and presentations with credit. That makes it a better external anchor than a table copied from a blog post.
What it does not do: tell you what your account should hit. Use it as the one external anchor in the workflow below, next to your own baseline.
What do the 2026 Google Ads benchmarks say?
The 2026 search advertising benchmarks, published by LocaliQ in June 2026 from thousands of its customers' campaigns, put the cross-industry averages at $5.42 CPC, 6.64% CTR, 8.18% conversion rate and $66.69 cost per lead (LocaliQ, 2026 Search Advertising Benchmarks). Cost per lead fell for the first time in five years.
The spread between industries is the useful part, not the average:
| Industry | Metric | 2026 figure |
|---|---|---|
| Arts and Entertainment | CPC | $1.63 |
| Arts and Entertainment | CTR | 12.75% |
| Restaurants and Food | CPC | $2.05 |
| Restaurants and Food | Cost per lead | $30.57 |
| Attorneys and Legal Services | CPC | $9.87 |
| Attorneys and Legal Services | Cost per lead | $131.63 |
| Animals and Pets | Conversion rate | 16.22% |
Source: LocaliQ, 2026. A legal-services advertiser paying $9.87 a click is not doing worse than a restaurant paying $2.05. They are buying a different customer.
The rest of this guide was written on the 2025 dataset, which is still the best-documented one for method: how the numbers were gathered and how to read them. The reading rules have not changed.
What did the 2025 benchmark dataset cover?
WordStream and LocaliQ aggregate anonymized performance from client accounts across Search, Display, and Shopping-style campaigns. The April 2024 to March 2025 window captures post-pandemic normalization, continued Smart Bidding adoption, and rising competition in lead gen and local services.
The report publishes averages for metrics like click-through rate (CTR), cost per click (CPC), conversion rate (CVR), and cost per lead (CPL) by industry. Those averages are useful for orientation. They are dangerous when copied into forecasts without adjustment.
When we audit agency accounts, the first question is never "are we below the WordStream average?" It is "did our CPA change faster than our market's?" External benchmarks answer the second question only after you define your market.
How should you read CPC benchmarks without panic?
CPC increases dominated the 2025 report. Roughly 87% of industries saw higher average CPC year over year. That sounds catastrophic until you remember CPC is an input, not an outcome.
Rising CPC can mean several things:
More auction density. More brands bid on the same high-intent queries. That is market competition, not broken strategy.
Match type expansion. Broad match plus Smart Bidding finds expensive pockets of demand. If those clicks convert, higher CPC is acceptable.
Quality Score drag. Weak ads and landing pages force you to pay more per click for the same position. Fix relevance before raising budgets.
Geographic or device mix shifts. A campaign that skews mobile or premium metros will inflate averages. Segment your data before comparing to broad national benchmarks.
What to do instead of panicking (30 minutes)
Export your Google Ads search terms report for the last 90 days. Sort by cost. Flag terms where CPC rose more than 20% while CVR flatlined. Those terms need creative, landing page, or negative keyword work, not a higher budget.
For how paid and organic signals interact in 2026, see how Google organic and paid search work together.
Why was CTR mixed across industries?
CTR is the most abused benchmark metric. A high CTR with low CVR usually means misfired intent or clickbait copy. A low CTR with strong CVR can mean tight targeting.
The 2025 dataset showed mixed CTR movement by vertical. Categories with urgent intent (legal, home services, healthcare adjacencies) often sustain stronger CTR on exact and phrase match. Awareness-heavy categories fight noisier feeds and more ad formats on the SERP.
Do not optimize to benchmark CTR. Optimize to qualified click rate: clicks that reach a thank-you page or revenue event. If your CTR trails peers but CVR leads, you may be filtering better, not losing.
What conversion rate trends tell you
Conversion rate improved for about 65% of industries in the WordStream analysis. That suggests many advertisers tightened landing pages, improved offers, or let Smart Bidding concentrate spend on converting audiences.
CVR benchmarks still fail accounts with broken tracking. Before you compare to any table, confirm three things:
- Primary conversion actions match business value. Form fills that never call back distort optimization.
- Enhanced conversions or offline imports capture delayed sales. Multi-touch paths and phone calls matter.
- Cross-device paths are not double-counted. GA4 and Google Ads attribution can overlap.
Time estimate: 45 minutes to validate conversion setup in Google Ads and GA4. Skipping this step makes every benchmark comparison meaningless.
How to use CPL benchmarks for lead gen planning
Cost per lead rose more gently than CPC, with roughly 5% average increase across the dataset. Milder CPL inflation means some accounts converted CPC pressure into efficiency gains. Others saw CPL spike when forms got longer, sales follow-up slowed, or lead quality dropped.
Use CPL benchmarks to stress-test your media plan:
- Take your last 90-day CPL median, not mean. Outliers distort means.
- Compare to the published range for your vertical.
- If you are 30%+ above range, diagnose offer, form, and sales speed before blaming auctions.
- If you are far below range, check lead quality and disqualification rates. Ultra-cheap leads may be junk.
Is $10 or $20 a day enough for Google Ads?
It is enough to learn, not enough to scale, and the benchmarks tell you why.
At the 2026 average CPC of about $5.42, $10 a day buys roughly 1 to 2 clicks a day, or 50 to 55 clicks a month. At an average conversion rate near 8%, that is 4 conversions a month. You can tell whether the landing page converts and which keywords are junk. You cannot run Smart Bidding, which needs a few dozen conversions a month to optimise.
At $20 a day you are near 110 clicks and 8 to 9 conversions a month. Still a learning budget. A local service business in a cheaper category (CPC under $3) gets about twice those numbers for the same money.
The practical rule: set the daily budget so you get at least 10 clicks a day on the keywords you care about. Divide your category's CPC into that and you have the floor. Below it, run exact match on the two or three highest-intent keywords only and skip the rest.
What are good metrics for Google Ads?
Three numbers say whether a Search campaign works, in this order:
- Cost per conversion against what a conversion is worth. A $66 cost per lead is good for a $2,000 service and fatal for a $40 product. This is the only metric that decides budget.
- Conversion rate against your own landing page history. Industry average is around 8%. If you are under 3%, the page or the offer is the problem, not the ads.
- CTR against the keyword's intent. Around 6.6% on Search is average. A CTR far above average with a low conversion rate means the ad promises something the page does not deliver.
Impression share, Quality Score and clicks are diagnostics. They explain a bad number; they are not the number.
A practical benchmark workflow (not a fake industry table)
Instead of copying WordStream's industry grid into slides, run this quarterly review:
Step 1: Baseline your account (20 minutes)
Pull account-level CPC, CTR, CVR, and CPA or CPL for trailing 90 days and same period last year. Write down your own trends first.
Step 2: Segment by campaign type (30 minutes)
Split Search brand, Search non-brand, Performance Max, and Display. Averages lie when brand cheap clicks hide non-brand pain.
Step 3: Compare to one external anchor (15 minutes)
Read the WordStream report for your vertical directionally. Note whether CPC, CVR, and CPL moved up or down versus last year's report. You are looking for macro pressure, not a report card.
Step 4: Competitive context (optional, 30 minutes)
Use auction insights and competitor landing page reviews. Benchmarks tell you market weather. Competitor creative tells you whether you are the problem.
Our competitor website analysis guide covers the landing page side of that review.
Common benchmark mistakes to avoid
Mistake 1: Treating averages as KPIs. Industry CPL of $45 does not mean your $72 account is broken if you sell high-ticket services with 40% close rates.
Mistake 2: Ignoring match type mix. An account running 70% broad match will not match a benchmark built on tighter match portfolios.
Mistake 3: Chasing CTR with gimmicks. Emoji-stuffed headlines can lift CTR while destroying lead quality.
Mistake 4: Updating budgets before fixing Quality Score. Paying more per click without relevance work is a treadmill.
What to do next
Pull your trailing 90-day metrics before you open another benchmark PDF. Compare year over year first, WordStream second. Fix tracking, segment brand versus non-brand, then decide whether auction pressure or account structure explains the gap. Benchmarks start conversations. Your data closes them.
Benchmarks tell you the average. To see the CPC and competition of your own keywords, use the Keyword Research tool in Pengu Insights. Free plan, no card.
FAQs
What did the 2025 Google Ads benchmarks report find?
WordStream and LocaliQ analyzed more than 16,000 campaigns from April 2024 through March 2025. Average CPC rose for roughly 87% of industries. Conversion rate improved for about 65%. Cost per lead increased more mildly, around 5% on average. CTR results were mixed by vertical.
Should I copy industry benchmark tables into my media plan?
No. Published benchmark tables are directional averages, not targets for your account. Use them to sanity-check whether your CPC or CPL is wildly off-market, then diagnose with your own auction data, landing pages, and conversion tracking.
Why did Google Ads CPC rise for most industries in 2025?
More advertisers competing for the same intent, smarter bidding pushing auctions higher, and quality gaps that force accounts to buy clicks instead of earning them through relevance all contribute. Rising CPC is often a symptom of auction pressure plus weak Quality Score, not a universal tax.
How often should I review Google Ads benchmarks?
Quarterly is enough for most teams. Revisit after major platform changes, seasonal peaks, or when your CPA drifts more than 15% from plan. Pair external benchmarks with your own year-over-year account trends.
What is a good Google Ads CTR in 2025?
There is no single good CTR. Search campaigns in high-intent niches can exceed 5%. Display and broad prospecting will look worse by design. Compare your CTR to your historical baseline and to close competitors in the same match type, not to a generic industry average.
Is $10 a day enough for Google Ads?
It is enough to test a landing page and find bad keywords, not enough to scale. At an average CPC around $5, $10 a day is about 50 clicks and 4 conversions a month, below what automated bidding needs to learn.
What is a good conversion rate for Google Ads?
The 2026 cross-industry average is about 8% on Search. Under 3% usually points to the landing page or the offer rather than the ads. Judge it against your own history first and the industry figure second.
Written by

Founder of Pengu Insights. Competitive intelligence practitioner for DTC brands and marketing agencies.