LinkedIn is the one social platform where a small audience can be worth more than a large one, and LinkedIn analytics is how you prove which one you have. Five hundred impressions among heads of marketing at companies you sell to is a better month than fifty thousand impressions among people who will never buy. Most LinkedIn reporting misses this completely, because it leads with follower count.
Key takeaways
- Native page analytics is free and covers most of what you need for your own page.
- The metric that matters in B2B is who saw it, not how many.
- Competitor comparison inside LinkedIn is real but shallow.
- Third-party tools earn their keep on post-level competitor patterns and multi-brand reporting.
Video: reading LinkedIn analytics without fooling yourself
Twelve minutes on personal profile and company page analytics, with one lesson most reports miss: the time window changes the story.
Three things worth taking from it:
- Never decide on a seven-day window. Her own profile showed +48% over seven days and -16% over 90 days. Neither was the trend; the 365-day view was.
- Outlier posts distort every comparison. Two viral posts in one quarter make the next quarter look like a decline. Export the data and remove them before comparing periods.
- Personal profiles now get real analytics. LinkedIn's algorithm favours posts from people over pages, and the profile analytics screen is where those numbers live.
The metrics section below assumes you have already done this: picked a window long enough to mean something and exported it.
What native LinkedIn analytics gives you
For a company page admin, free:
- Impressions and unique impressions per post
- Reactions, comments, reposts, and click-through rate
- Follower growth over time, with sources
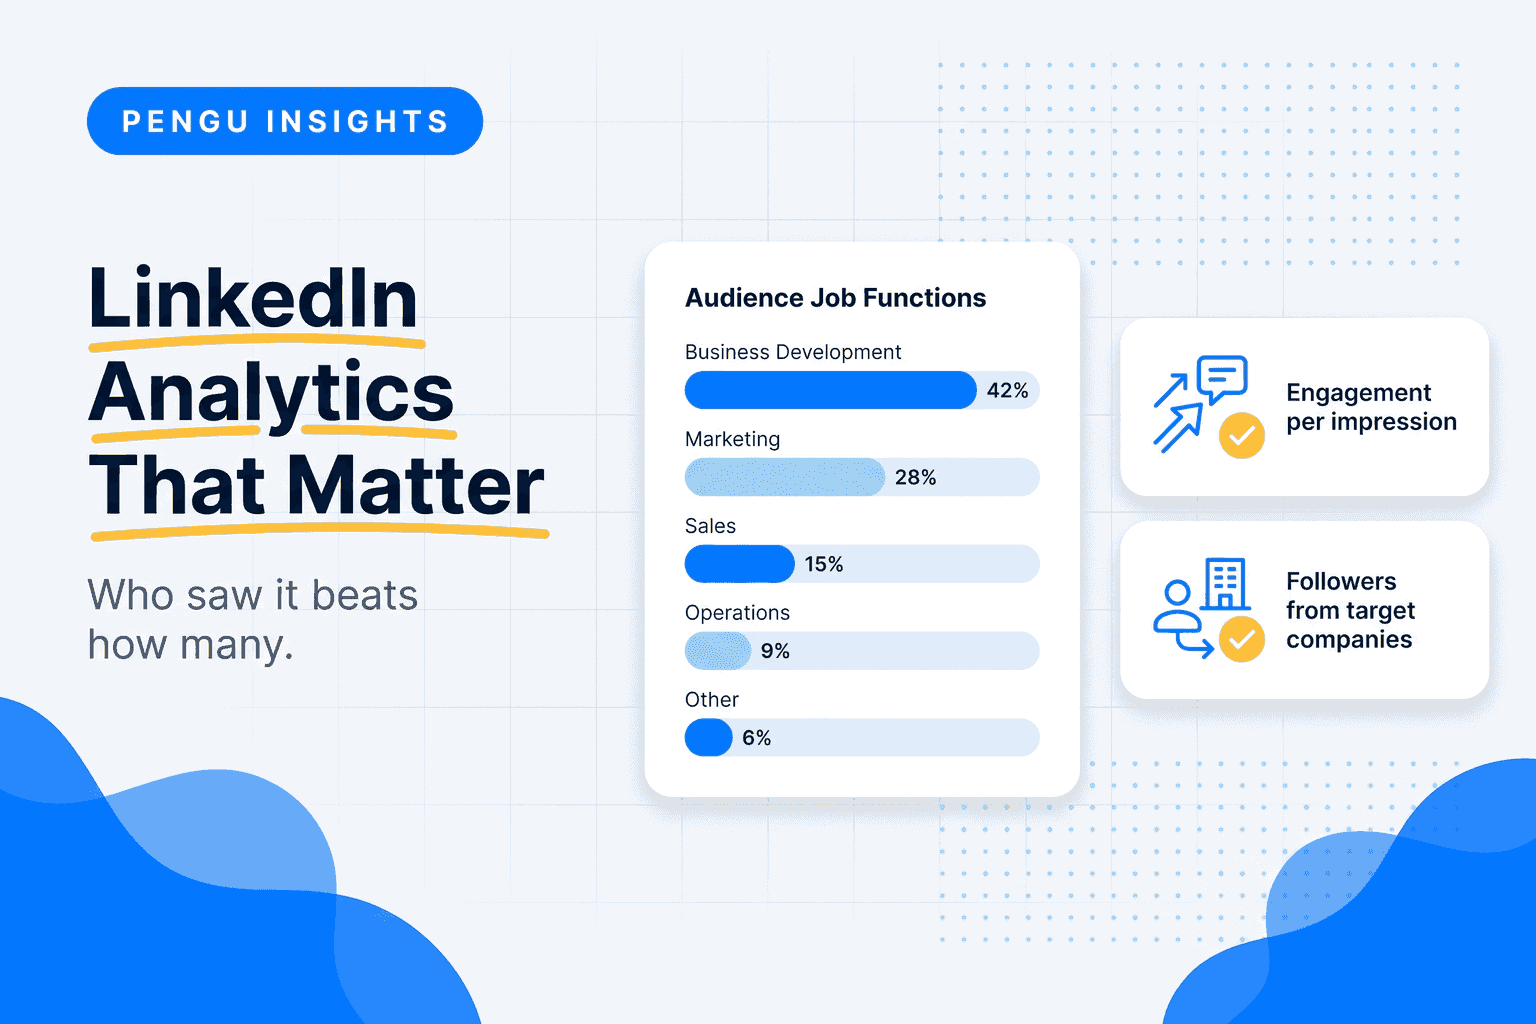
- Visitor demographics: job function, seniority, industry, company size, location
- A basic competitor comparison for pages you add manually
That demographic breakdown is the most valuable free data on any social platform, and the least used. It answers whether your content reaches buyers or peers.
Personal profiles get less: post impressions, top demographics of viewers, and profile views. Since most B2B reach on LinkedIn now comes from personal profiles rather than company pages, that asymmetry is a real reporting problem.
The metrics worth reporting
1. Impressions among target titles
Take the demographics breakdown and calculate what share of impressions came from the job functions and seniorities you sell to. If 70 percent of your reach is other marketers and you sell to finance directors, the account is entertaining the wrong room.
2. Engagement rate per impression
Reactions plus comments plus reposts, divided by impressions. Most company pages land between 1 and 4 percent. Track the trend, not the absolute.
3. Follower growth from target companies
LinkedIn tells you which companies your followers work at. Growth concentrated in your ICP is worth ten times growth spread across the internet.
4. Comment depth
Count comments longer than a few words from people outside your company. Reaction counts are cheap; a paragraph from a prospective buyer is a sales signal.
5. Click-through to product or gated content
The only metric here that connects LinkedIn to pipeline. Track it per post format so you learn which format earns the click.
What native analytics cannot do
- Competitor post-level analysis. The built-in comparison gives you follower counts and topline engagement, not the format mix, cadence, or hook patterns behind them.
- History beyond the retention window. Year-over-year comparisons need someone storing the data.
- Multi-brand reporting. Agencies with eight clients need one export.
- Personal profile aggregation. If five employees carry your reach, native tooling will not roll that up for you.
Tools that fill those gaps
Shield
Personal-profile analytics with long history, from roughly $25 a month. The standard pick for founders and executives who post personally.
Metricool
Free tier plus affordable paid plans, with LinkedIn covered alongside other networks and exportable client reports.
Sprout Social and Hootsuite
$99 to $299 per seat. Suite reporting where LinkedIn is one tab. Worth it for large teams; expensive if LinkedIn analytics is the only reason you are buying. See Sprout Social alternatives.
Pengu Insights
Ours. LinkedIn Posts and LinkedIn intelligence run from $39 a month and focus on the competitor side: which posts and formats earn reach for the companies you compete with, cadence, and benchmarking against your own page, in the same workspace as Instagram and TikTok intelligence and the SEO layer.
Not for: publishing or inbox. It reads, it does not post.
A reporting template that survives a board meeting
Five lines, monthly:
- Impressions, and the share among target job titles
- Engagement rate per impression, versus last month
- New followers from target companies, named where notable
- Best-performing post, with the reason it worked in one sentence
- Next month's test, with the format and the hypothesis
Anything longer gets skimmed. Anything shorter gets questioned.
Where to go next
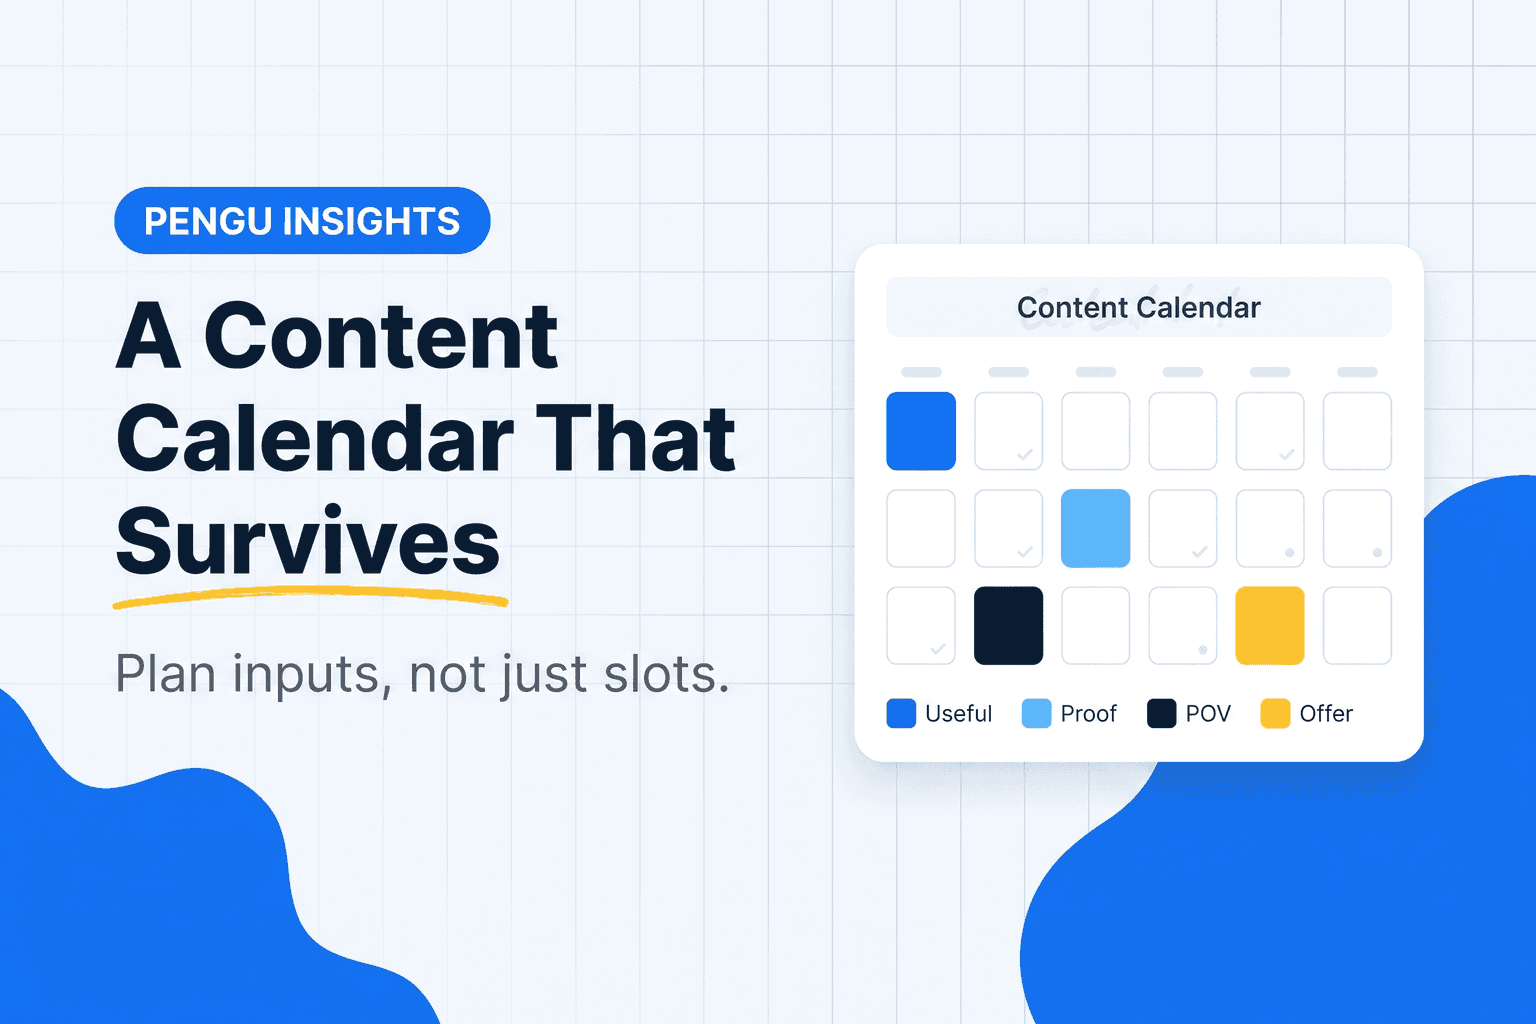
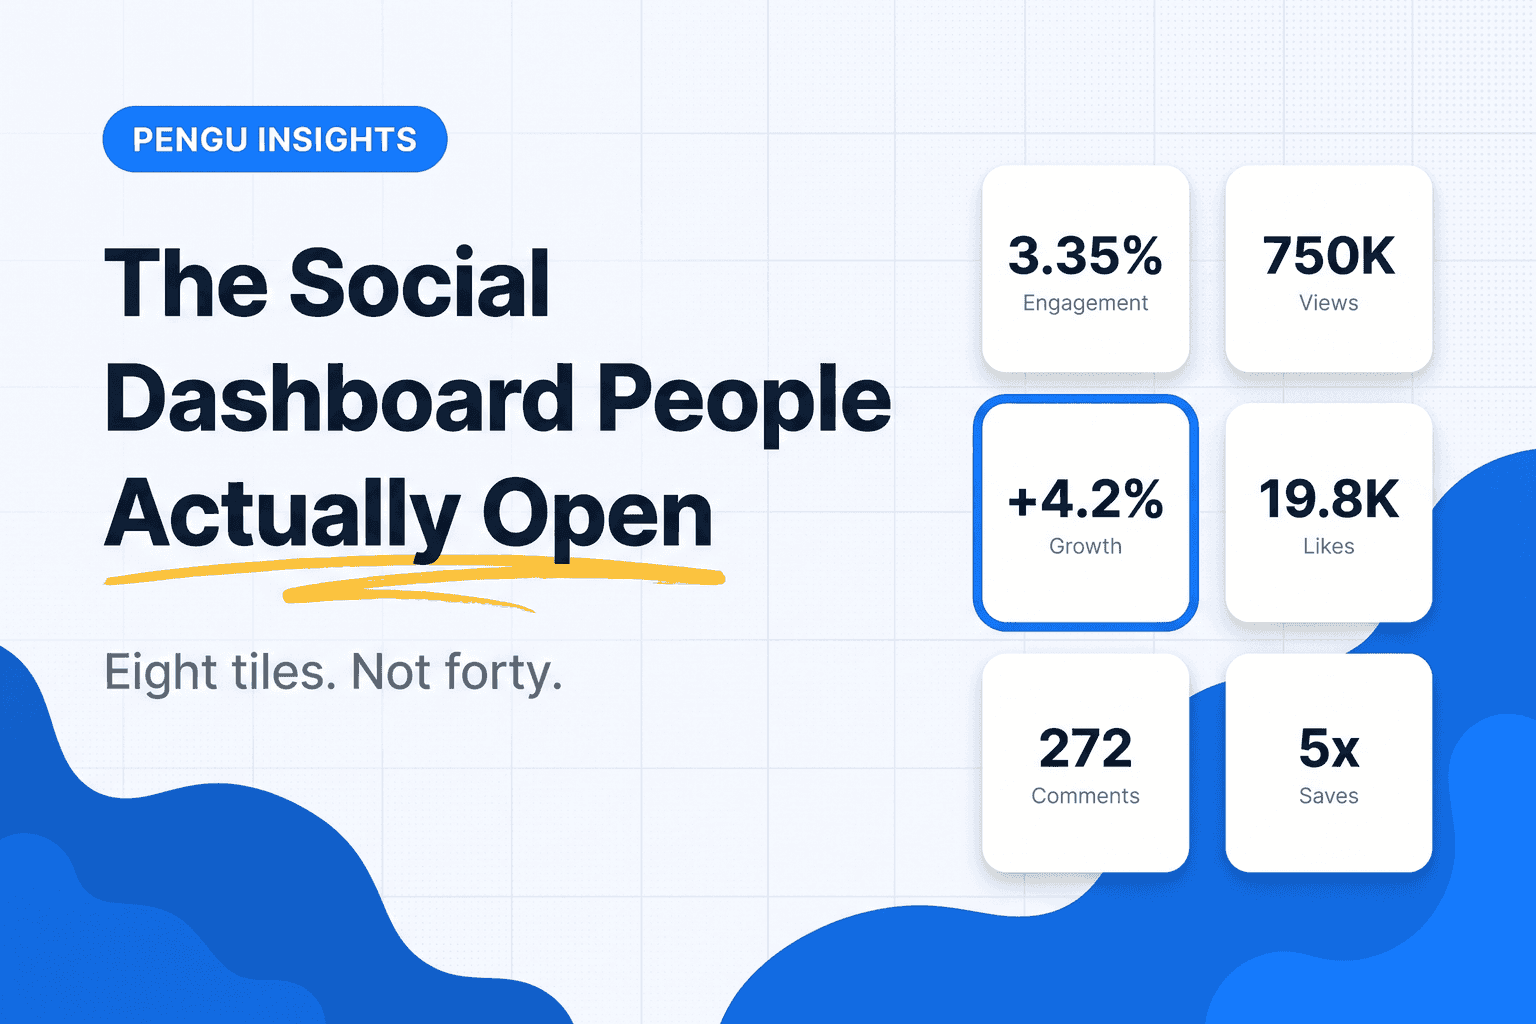
LinkedIn is one tile in a bigger view: social media dashboard covers the other seven, and social media content calendar covers filling it.
To see which LinkedIn posts perform for a competitor and why, run their page through LinkedIn Posts in Pengu Insights. Free plan, no card.
Frequently asked questions
What does LinkedIn analytics show?
Page analytics shows impressions, unique impressions, reactions, comments, reposts, click-through rate, follower growth, and visitor demographics by job function, seniority, industry, and company size.
What is a good engagement rate on LinkedIn?
Most company pages sit between 1 and 4 percent per impression. Above 5 percent consistently is strong, but audience composition matters more than the rate.
Can you see analytics for a competitor's LinkedIn page?
LinkedIn offers a limited competitor comparison with follower counts and post engagement. Deeper post-level analysis requires a third-party tool reading public data.
Which LinkedIn metrics matter for B2B?
Impressions among target job titles, engagement rate per impression, follower growth from target companies, and click-throughs. Raw follower count matters least.
Do LinkedIn analytics tools cost money?
Native page analytics is free. Third-party tools start around $25 a month and reach $99 to $299 per seat in enterprise suites.
Related guides
LinkedIn rarely works alone in a B2B mix. Read social media analytics tools for the cross-channel view, and competitive intelligence tools if benchmarking against rivals is the real job.
Written by

Founder of Pengu Insights. Competitive intelligence practitioner for DTC brands and marketing agencies.