Instagram gives you excellent analytics for free. That is the part most posts about Instagram analytics tools skip, because it makes the affiliate links harder to justify. Native Insights reports your reach, saves, and follower splits with data no third-party tool can improve on, because they are estimating what Instagram measures directly.
So the honest question is not "which Instagram analytics tool is best". It is "which of the three jobs Insights cannot do do you need".
Key takeaways
- For your own account, native Insights is the most accurate source that exists.
- Paid tools exist for competitor tracking, multi-brand reporting, and long-term history.
- Nobody can see a competitor's reach or impressions. Any tool claiming otherwise is estimating.
- Track saves, shares, and non-follower reach. Likes stopped being a useful signal years ago.
Video: how to read the numbers Instagram already gives you
Before paying for a tool, learn what the native Insights screen means. This ten-minute explainer does that for posts, Stories and Reels.
Three things worth taking from it:
- Engagement rate is accounts engaged divided by accounts reached, times 100. Instagram does not show it; you compute it. Most paid tools compute it the same way, so a tool is not buying you a different number.
- Reach and impressions diverge for a reason. Reach is people; impressions are views. The video's point: if the goal is followers, watch reach among non-followers and impressions from hashtags and Explore, because that is where strangers come from.
- Saves and shares outrank likes as a signal that content earned a second action. Profile activity (visits and taps after a post) is the metric closest to business outcomes.
The tools below matter once you need those numbers across months, across competitors, or in a client report. For your own account this week, the native screen is enough.
The three jobs native Insights cannot do
- Competitor accounts. Insights covers what you own. Nothing else.
- Cross-brand reporting. Agencies with ten clients need one export, not ten logins.
- History. Instagram's retention window is short. If you want a year-over-year comparison, someone has to store it.
If none of those three describes your week, stop reading and save your money.
The 8 Instagram analytics tools
1. Instagram Insights: free, native, unbeatable on your own data
Reach split by followers and non-followers, saves, shares, profile visits, and Reels watch time, straight from the source.
Best for: every single brand, as the baseline. Limit: your accounts only, short history.
2. Metricool: free tier plus real reporting
A generous free plan and paid tiers that stay affordable, with competitor tracking and exportable reports.
Best for: small teams and agencies where the monthly report is the deliverable.
3. Later: visual planning with analytics attached
From around $25 a month. Best-in-class grid planning, with performance data attached to the calendar rather than sitting in a separate tab.
Best for: visual-first brands that plan a month ahead.
4. Buffer: light analytics, cheap publishing
From roughly $6 per channel. Analytics are basic but sufficient if you mostly need to know which posts performed.
Best for: solo operators.
5. Iconosquare: Instagram-native depth
One of the older specialists, with strong benchmarking against industry averages.
Best for: brands that want category benchmarks, not just competitor accounts.
6. Sprout Social: enterprise reporting
$199 to $299 per seat per month. Deep reporting and competitor modules on higher tiers. See our Sprout Social alternatives piece if the seat price is the blocker.
Best for: larger teams with approval workflows.
7. Hootsuite: suite coverage
About $99 per user per month annual. Analytics are adequate; the value is breadth across networks. Compare in Hootsuite alternatives.
Best for: teams already inside the suite.
8. Pengu Insights: competitor-side Instagram intelligence
Ours. From $39 a month, Instagram Intelligence covers the accounts you compete with rather than the one you own: posting cadence, format mix, engagement rate, top-performing content, and benchmarking against your own account. It sits beside TikTok and LinkedIn intelligence, the Facebook ad library, and the SEO layer, which is the point: the same brand usually wins on all three surfaces at once.
Best for: knowing what rivals do that works. Not for: scheduling posts. We do not publish.
The five metrics worth tracking in 2026
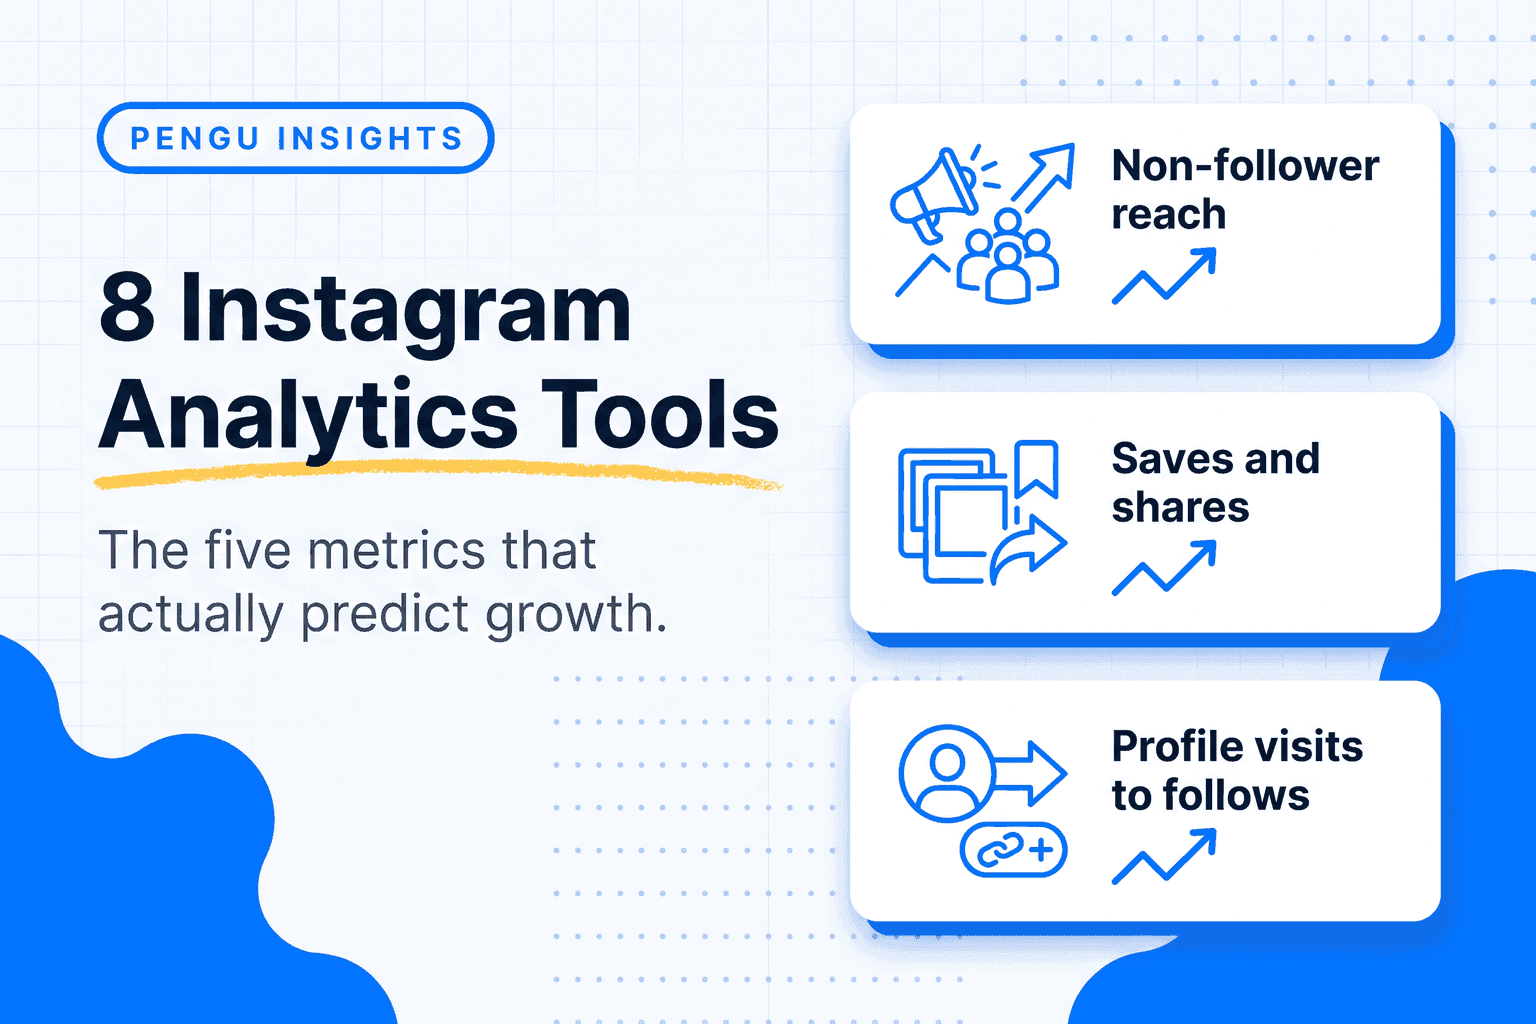
- Non-follower reach share. The clearest signal that the algorithm is distributing your content beyond people who already know you.
- Saves and shares. Both signal utility. A post with high saves and low likes is usually your best-performing content commercially.
- Reels watch time and retention. Completion beats view count. A 12-second average on a 20-second Reel is a strong asset.
- Profile visits to follows. Measures whether your bio and grid convert the attention your content earns.
- Link clicks per post type. The only metric on this list that connects Instagram to revenue.
Follower count belongs in the report only because clients ask for it.
How to benchmark against competitors honestly
Public data gives you post frequency, format mix, likes, comments, and follower growth. From that you can compute engagement rate per follower and per post, which is comparable across accounts of different sizes.
What you cannot get, from any tool, at any price: their reach, impressions, saves, story views, or link clicks. If a vendor implies otherwise, they are modelling, and you should ask how.
The workflow that produces decisions:
- Pick five accounts you genuinely compete with for attention, not the five biggest in your category. Our post on examples of competitors covers the distinction.
- Log four weeks of their posts: format, hook, topic, engagement.
- Find the format they win with that you do not run.
- Test it four times before judging it.
Where to go next
Put the numbers somewhere you will read them with a social media dashboard, and compare them honestly using competitive benchmarking.
To analyze any public Instagram account, yours or a competitor's, run it through the Instagram analyzer in Pengu Insights. Free plan, no card.
Frequently asked questions
What is the best Instagram analytics tool?
For your own account, Instagram Insights, free and native. Paid tools earn their place on competitor tracking, multi-brand reporting, and long-term history.
Is Instagram Insights enough?
For a single brand with one person running it, usually yes. You outgrow it when you need competitor benchmarking, client reports, or older data.
Can you see analytics for a competitor's Instagram account?
Not through Instagram. Third-party tools estimate competitor performance from public data. Reach and impressions for other accounts are never available.
Which Instagram metrics actually matter in 2026?
Non-follower reach, saves and shares, Reels watch time, profile visits to follows, and link clicks.
How much do Instagram analytics tools cost?
Free tiers exist. Mid-market tools run roughly $25 to $60 a month. Enterprise suites charge $99 to $299 per seat.
How do I calculate Instagram engagement rate?
Divide accounts engaged by accounts reached and multiply by 100. Both numbers are in the post's Insights. Rates by reach are more honest than rates by followers, because reach is who actually saw the post.
Related guides
Instagram rarely stands alone. Compare the whole category in social media analytics tools, and read social media monitoring tools if listening rather than reporting is your gap.
Written by

Founder of Pengu Insights. Competitive intelligence practitioner for DTC brands and marketing agencies.